Agentic Finance OS
Capture every financial document and system, structure it into one Agentic Lakehouse, and deploy Super Intelligence on top, for unified financial intelligence, as one operating layer.
How finance teams operate today
Industry-specific data silos and manual processes that slow down decision-making
Scattered Data, Different Formats
Financial statements, operational reports, and documents live across disconnected systems in different formats, and nothing connects.
Manual Reporting Loops
Teams pull data from multiple operating systems, copy-paste into spreadsheets, manually compute figures, and rebuild the same reports every review cycle.
No Way to Ask Follow-Up Questions
Static reports can't answer ad-hoc questions. Every follow-up means another manual review cycle from scratch.
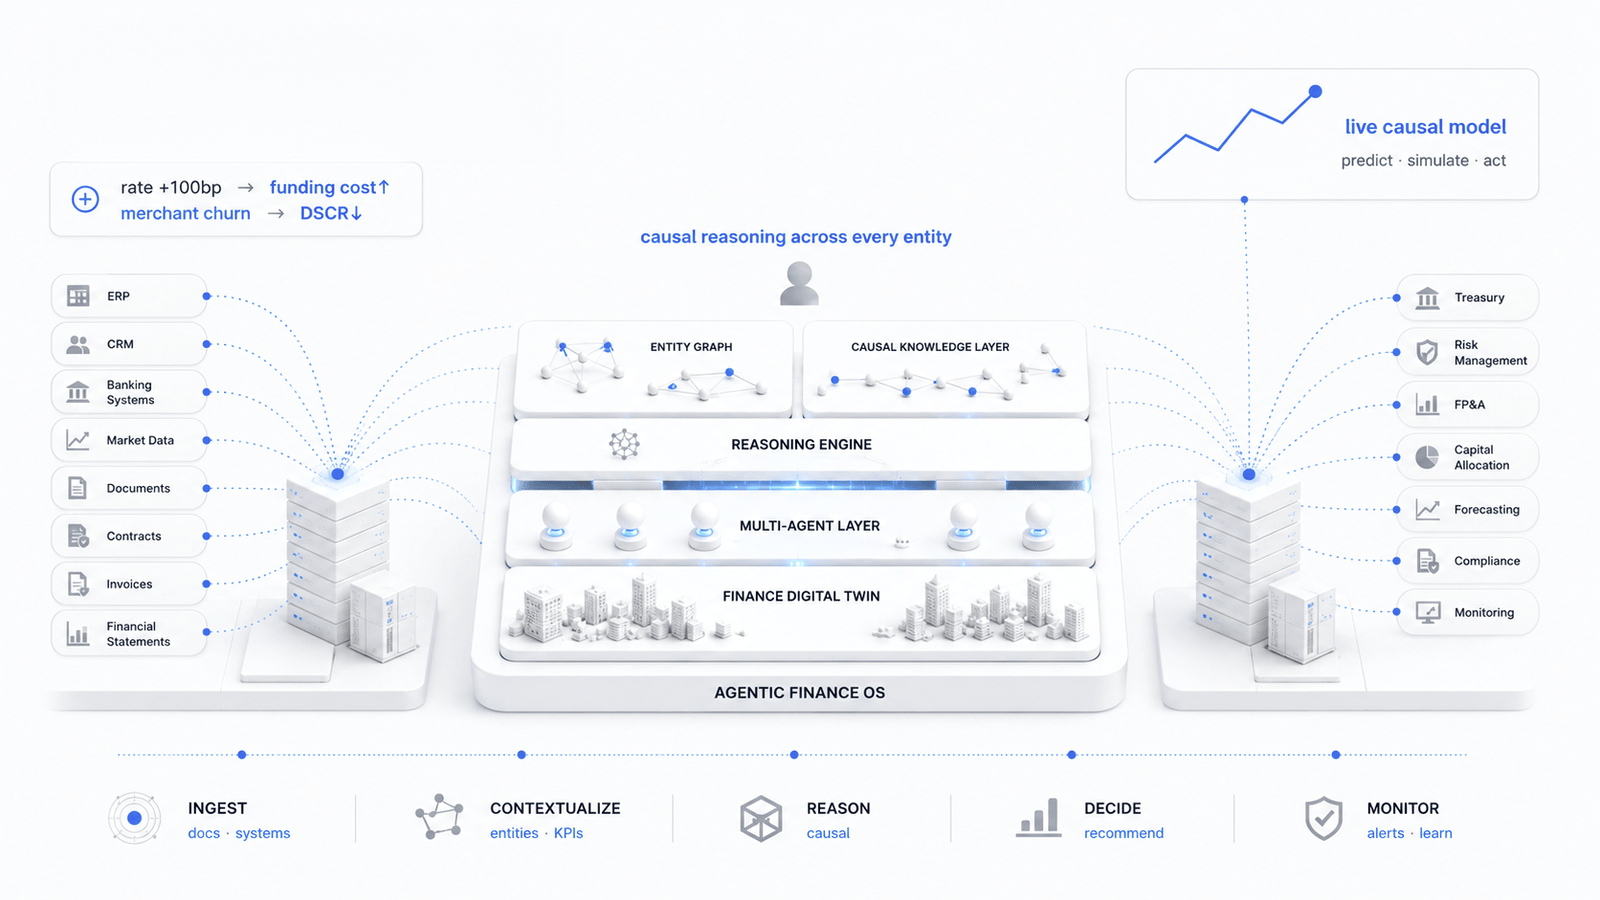
One operating layer, end to end
Ingest every system and document, contextualize into entities and KPIs, reason causally across the portfolio, then decide and monitor.
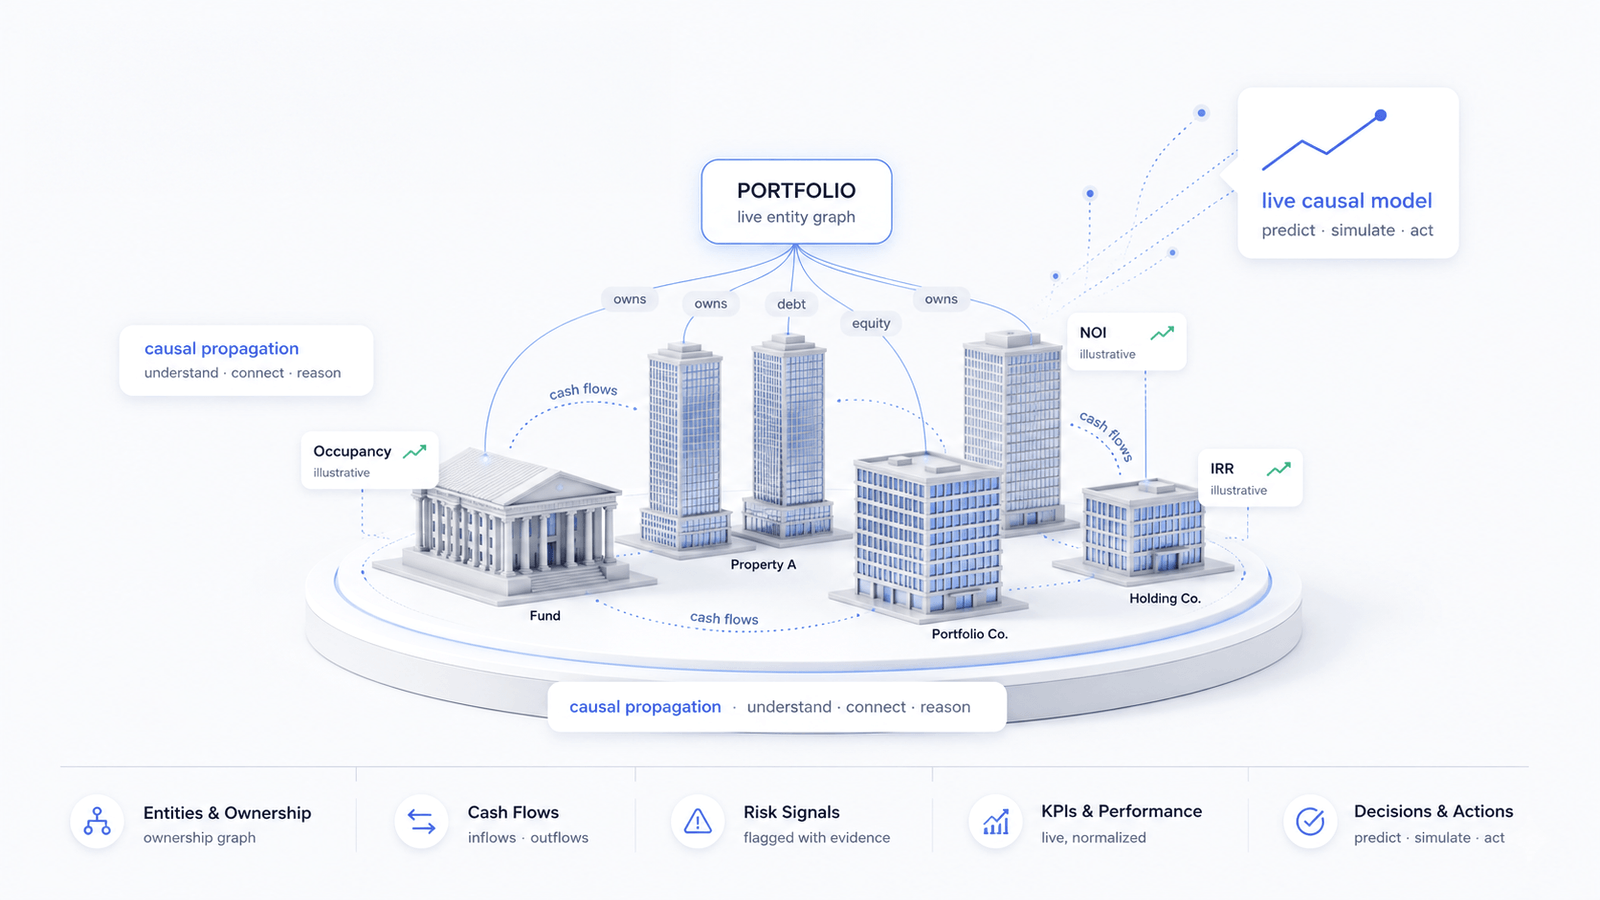
A live model of your entire portfolio
For asset owners and investment teams, DeepAuto connects portfolio, entity graph, cash flows, risk and KPIs as one live model you can predict, simulate, and act on. Powered by Agentic OS.
Before vs after the OS
Drag the divider to compare fragmented finance ops with one operating layer.
One live console for the whole portfolio
Live portfolio health, DB-verified answers, and auto-generated reports, in one operating console.
Automated Ingestion
Connected to data rooms, portco financial reporting systems, and Excel files. Data pulls run automatically, with zero manual downloads.
KPI Normalization
Revenue, EBITDA, margins, leverage ratios, and covenant compliance standardized across all portfolio companies regardless of source format and industry.
Portfolio Dashboard
Real-time visualization: portco performance rankings, fund-level breakdowns, risk heat maps, and concentration analysis.
Ask Super Intelligence
Leadership asks 'Which portco has declining margins?' and gets instant, DB-verified answers with supporting charts.
Agentic Portfolio Intelligence
- • Portco A: revenue down ~18% QoQ.
- • EBITDA margin compressing.
- • Portco C EBITDA margin ~22%.
- • vs portfolio avg ~33%.
- • Top single name ≈ 55% of revenue.
- • Diversification below target.
- Portco A revenue down ~18% QoQ, covenant headroom narrowing.
- Portco C margin ~22% vs avg ~33%, COGS rising.
- Top name ≈ 55% of portfolio revenue, concentration risk.

Built for portfolio intelligence.
The Reality
Investment teams managing diverse portfolios across multiple funds pull data from property management systems, data rooms, and Excel files, each in a different format. Analysts spend days consolidating and normalizing it into KPIs, and reports are often out of date by the time they reach leadership. Each follow-up question starts another manual cycle.
Days of reporting → under 1 hour
What used to take analysts days of manual downloading, copy-pasting, and formatting now happens automatically. The entire reporting cycle, from raw data to executive-ready dashboard, completes in under an hour.
Stale snapshots → live portfolio view
Leadership no longer waits for monthly reports to see how assets are performing. KPIs update in real-time as data flows in from every source, across property management systems, data rooms, and portco financials.
Blind spots → proactive risk detection
Revenue concentration risk, margin outliers, and covenant watch items are now flagged automatically with evidence, before they become problems. No more surprises in quarterly reviews.
Static reports → conversational intelligence
Instead of requesting another spreadsheet, leadership simply asks a question and gets an instant, DB-verified answer with supporting charts.
The Results
Under the hood
The data foundation and AI engineer that power the operating layer.
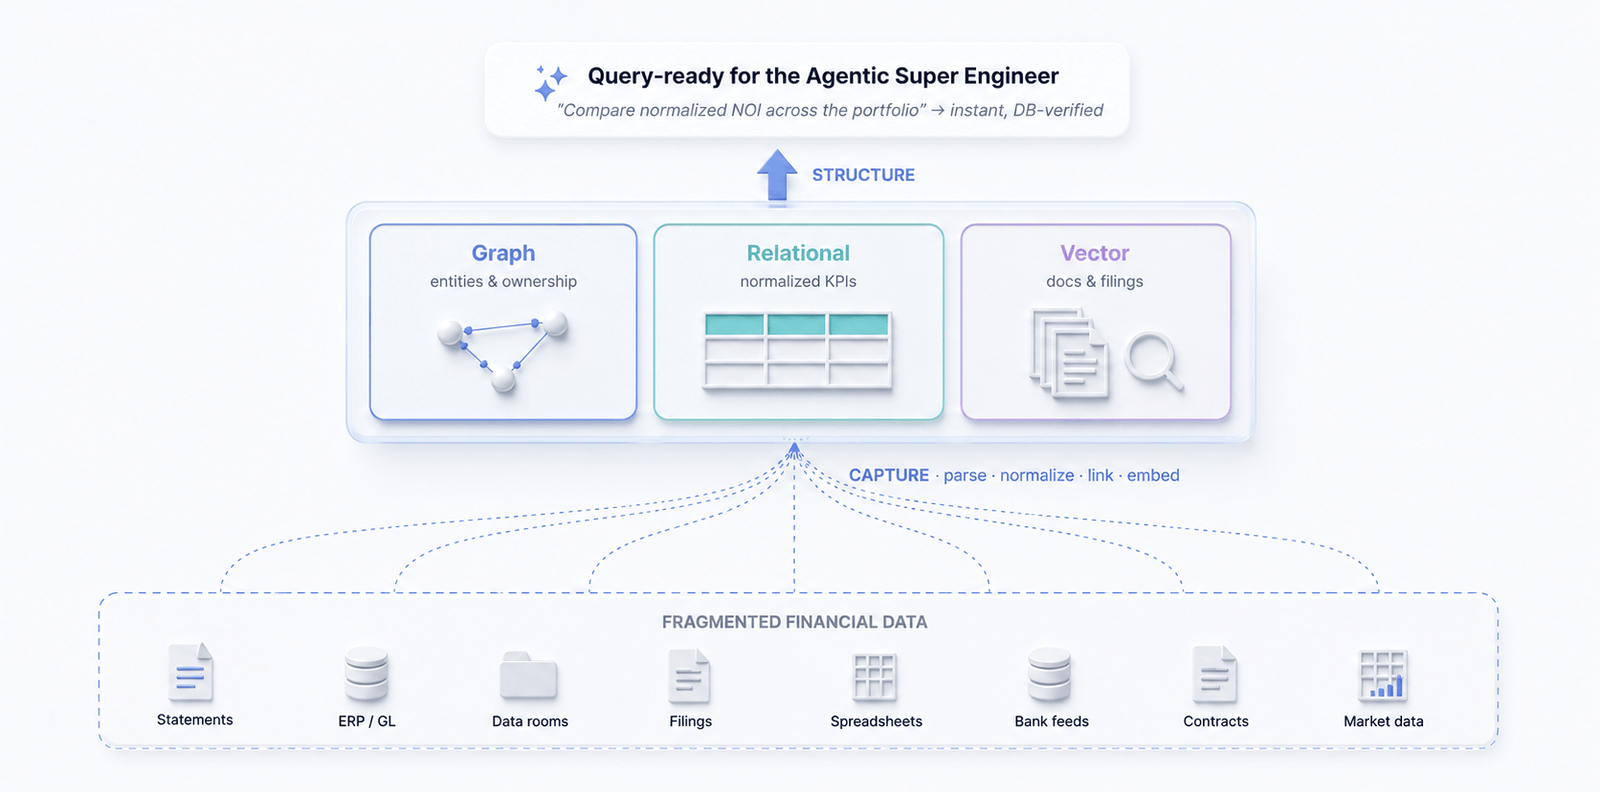
One lakehouse for every financial source
Capture statements, systems, data rooms and filings, structured into one query-ready store Super Intelligence can reason over.
Builds reports, flags risk, answers anything
Super Intelligence reasons over your lakehouse like your best analyst, turning one question into a DB-verified report, risk alert, or answer. Around the clock.
Builds reports
Turns one request into an executive-ready report, no manual pulls or copy-paste.
Detects risk
Flags concentration, variance, and covenant watch items with the evidence behind them.
Answers follow-ups
Ask anything in plain English; get a DB-verified answer, not another spreadsheet.
Explains every step
Shows the reasoning, sources, and numbers behind every answer.
Backed By


Trusted By


Ready to become
AI-first?
Schedule a 30-minute demo and see how DeepAuto turns your enterprise data and workflows into working intelligence, in weeks.