Agentic Portfolio Intelligence
Turn scattered financial statements, CIM documents, rent rolls, and portfolio reports into a unified, real-time portfolio dashboard. AI agents automate data ingestion, KPI normalization, risk detection, and report generation — so your team stops copy-pasting spreadsheets and starts making decisions.
The Challenge in Private Equity & Real Estate
Industry-specific data silos and manual processes that slow down decision-making
Scattered Data, Different Formats
Rent rolls in Excel, financials in data rooms, fund performance in another system. Property managers, deal teams, and portfolio analysts all use different formats — nothing connects.
Days of Manual Reporting
Analysts download data from property management systems, data rooms, and portco reporting tools, copy-paste into master spreadsheets, manually calculate KPIs, build charts, and write summaries. Reporting cycles that should take hours stretch into days.
No Way to Ask Follow-Up Questions
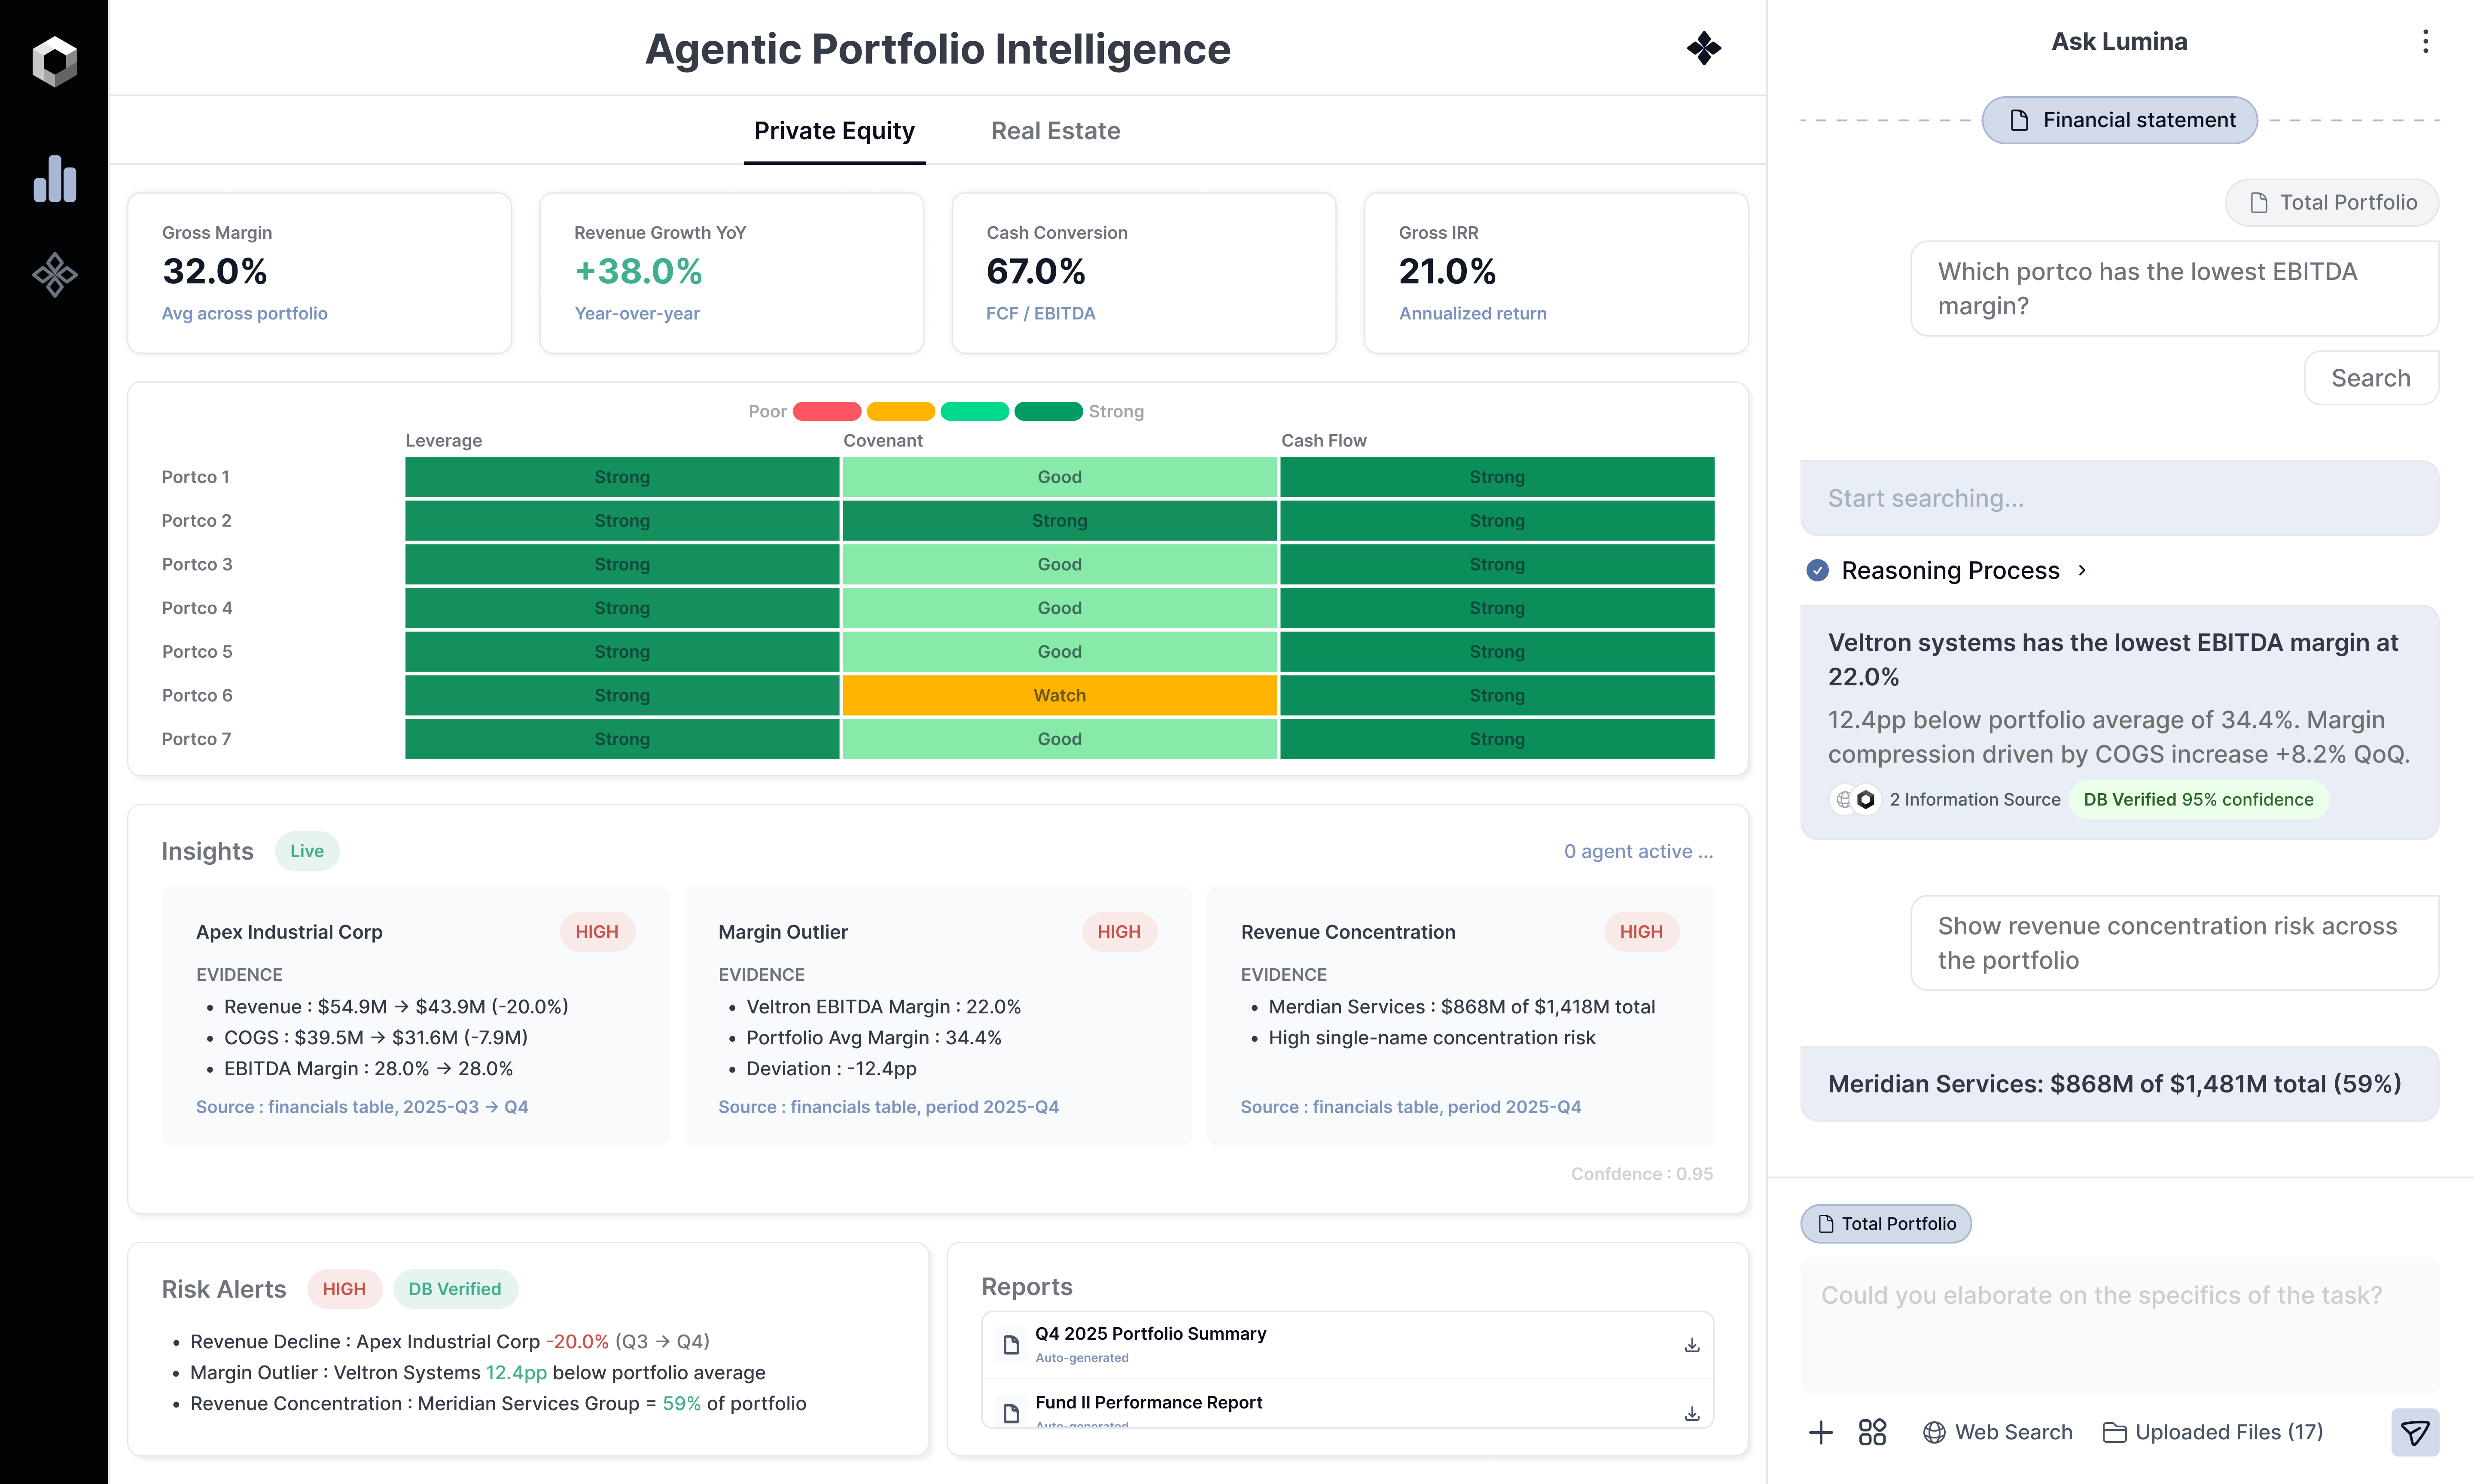
Static reports can't answer ad-hoc questions. When leadership asks 'Which portco has declining margins?' or 'Show aged receivables by fund,' it's another round of manual analysis.
AI Capabilities for Private Equity & Real Estate
Purpose-built AI agents that understand your domain
Automated Ingestion
Connects directly to property management systems, data rooms, portco reporting tools, and Excel files. Pulls data automatically on schedule.
KPI Normalization & Analysis
Standardizes occupancy, rent growth, NOI, IRR, MOIC, and aged receivables across all properties and portfolio companies.
Portfolio Visualization & Monitoring
Real-time dashboards with portfolio distribution, regional breakdowns, fund comparisons, and drill-down to individual asset or portfolio company performance.
Ask Lumina — Natural Language Q&A
Ask questions about any property, fund, deal, or KPI in plain English. Lumina instantly returns DB-verified answers with charts.
How It Works
From raw data to intelligent insights — powered by AI agents
Automated Ingestion
Connected to data rooms, portco financial reporting systems, and Excel files. Data pulls run automatically — zero manual downloads.
KPI Normalization
Revenue, EBITDA, margins, leverage ratios, and covenant compliance standardized across all portfolio companies regardless of source format and industry.
Portfolio Dashboard
Real-time visualization: portco performance rankings, fund-level breakdowns, risk heat maps, and concentration analysis.
Ask Lumina
Leadership asks 'Which portco has declining margins?' and gets instant, DB-verified answers with supporting charts.

How investment firms use DeepAuto to transform portfolio reporting and risk detection
The Challenge
Investment teams managing diverse portfolios across multiple funds face the same challenge: data scattered across property management systems, data rooms, and Excel files — all in different formats. Analysts spend days downloading, normalizing, and manually calculating KPIs. By the time reports are ready, the numbers are stale. When leadership asks a follow-up question, it means starting another manual cycle from scratch.
Days of reporting → under 1 hour
What used to take analysts days of manual downloading, copy-pasting, and formatting now happens automatically. The entire reporting cycle — from raw data to executive-ready dashboard — completes in under an hour.
Stale snapshots → live portfolio view
Leadership no longer waits for monthly reports to see how assets are performing. KPIs update in real-time as data flows in from every source — property management systems, data rooms, and portco financials.
Blind spots → proactive risk detection
Revenue concentration risk, margin outliers, and covenant watch items are now flagged automatically with evidence — before they become problems. No more surprises in quarterly reviews.
Static reports → conversational intelligence
Instead of requesting another spreadsheet, leadership simply asks a question and gets an instant, DB-verified answer with supporting charts.
The Results
Explore Other Solutions
Ready to become
AI-first?
Schedule a 30-minute demo and see how DeepAuto can transform your enterprise data and workflows in weeks — not months.